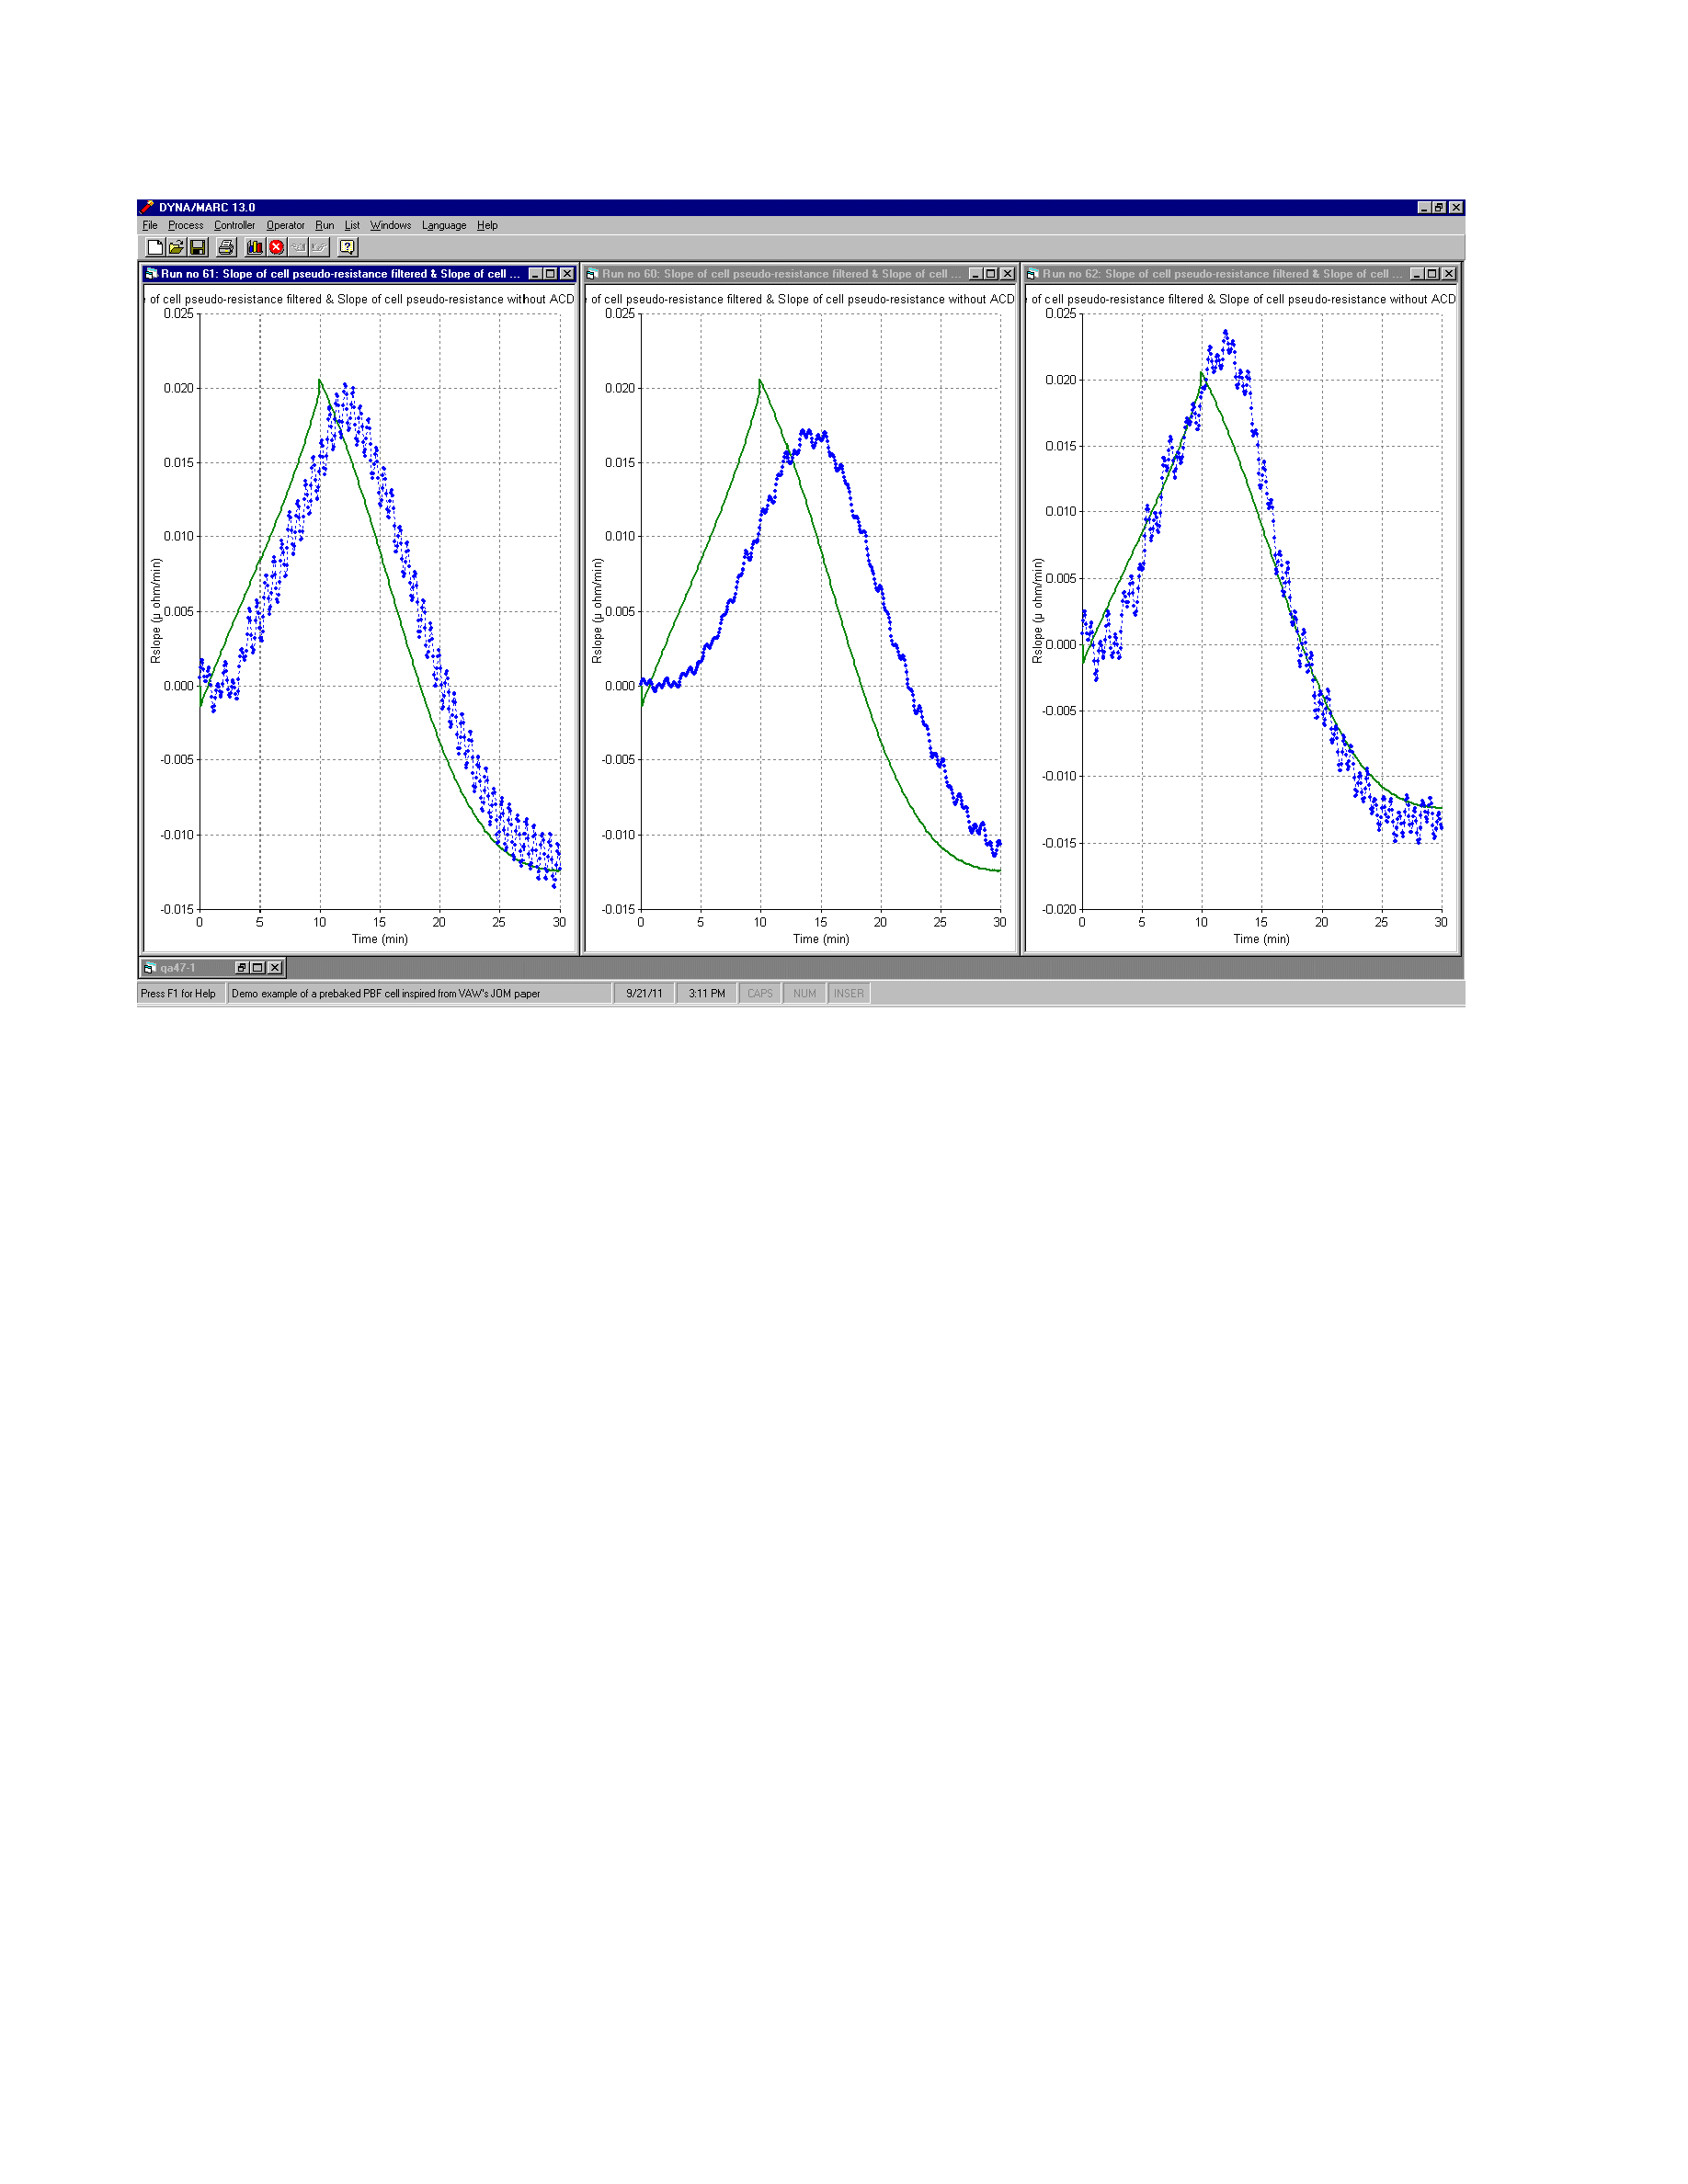
Figure 2: Noise-free (in green) and filtrated (in blue) slope of the cell pseudo-resistance using 60
datapoints linear RMS fit on the left, 120 datapoints linear RMS fit in the middle and 120 datapoints
quatratic RMS fit on the right.